Antiviral assays against sarbecoviruses A549-hACE2 in female Syrian golden hamsters
The antiviral assays against Pg-CoV, WIV-1 and SHC014 (zoonotic sarbecoviruses) were conducted in A549-hACE2 cells, as previously described61,62,66,67. Supplementary methods include detailed antiviral tests against human coronaviruses.
The housing conditions and experimental procedures were approved by the Johnson & Johnson Research & Development ethics committee. The size of the study and the statistical power analysis made it difficult to obtain statistical significance in the Syrian golden hamster studies. After arrival, the animals were randomly assigned to groups. No blinding was performed during the experiment. Female Syrian golden hamsters (Janvier Laboratories) aged 8–10 weeks were anaesthetized by isoflurane inhalation and inoculated intranasally with 100 μl of PBS containing 1 × 10⁴ TCID50 A day 0 saw the first of the series called SARS-CoV-2. The animals were treated orally starting at 10, 24 or 48 h.p.i. and continued to be dosed BID at 10 h intervals with vehicle or JNJ-9676 (75 mg per kg per dose in PEG400) (Fig. 3f). The animals were dosed BID at 08:00 and 16:00. On day 4 the hamsters were euthanized because of an illness. The whole right lungs were disrupted using the Precellys homogenizer. The lung homogenate supernatant was quantified by the results of the end-point virus titration and riboflavin test. The MagNA Pure 96 DNA andviral NA Small Volume Kit is a tool that can be utilized to extract nucleic acids. RT–qPCR was performed using the LightCycler Multiplex RNA Virus Master kit (Roche), and SARS-CoV-2 primers and probe as described above. For end-point titrations, a 1:10 serial dilution of the lung homogenate was prepared in 1× MEM (without phenol red (Thermo Fisher Scientific) supplemented with 2% FCS (Biowest), 2 mM alanyl-glutamine (Sigma-Aldrich) and 0.04% gentamicin (Thermo Fisher Scientific). This dilution series was then added to confluent Vero E6 cells in a 96-well plate and incubated for 72 h at 37 °C. The TCID50 is the amount of infectious particles that were determined by scoring the viruses cytopathic effects and the calculation methods used by the Reed–Muench method. The TCID50 liter1 values were normalized to the total lung weight and expressed as TCID50 per unit of tissue.
Uncut western blots for SARS-CoV-2 M-FabB-JNJ-9676 micrograph from extended data Fig. 6a
Uncut western blots are shown in the data. The quality control of theprotein was the point at which the blots were created.
In Extended Data Fig. 6a, a micrograph from the SARS-CoV-2 M–FabB–JNJ-9676 data collection is shown. In order to get this image, 12,988 images were taken.
There is a patent and a supplementary method for the synthesis of JNJ-9676. At MedChemExpress, the order was for mokupiravir and it was synthesised according to literature procedures. In some experiments, JNJ-9676 and molnupiravir were dissolved in 100 mMDMSO to produce a 5– 100 mM stock. In an experiment, JNJ-9676 was dissolved in 100% PE 200 for a specified amount of time, with or without molnupiravir.
A group of cells were grown in the lab with penicillin, streptomycin and 5% FBS. DMEM with 5% FBS, penicillin (100 U ml−1) and streptomycin (100 μg ml−1) was used for MERS-CoV infection experiments. HCT-8 cells (human colorectal carcinoma cell line obtained from ATCC, CCL-244) were cultured in DMEM supplemented with 5% FBS. DMEM + 3% FBS was used for HCoV-OC43 infection experiments. A cell line obtained from ATCC, CCL-94, was cultured in the DMEM and supplemented with antibiotics. The medium was used for experiments that involved a sexually transmitted disease. LLC-MK2 cells (a rhesus monkey kidney epithelial cell line, obtained from ATCC, CCL-7) were cultured in MEM with Hanks’ and Earle’s salts supplemented with 5% FBS. MEM and 3% FBS were used for the HCoV-NL63 infections. Vero cells (ATCC, CCL-81) were cultured in DMEM supplemented with 5% FBS, penicillin (100 U ml−1) and streptomycin (100 μg ml−1). DMEM with penicillin (100 U ml−1), streptomycin (100 μg ml−1) and 1 µg ml−1 trypsin was used for PEDV infection experiments. Cell lines did not test negative for mycoplasma.
A high-contentimaging (HCI)-based test was used to determine the antiviral activity and compound toxicity of the two strain of coronaviruses (SRES-CoV-2 and FPM1 strain).
Recombinant viruses, derived from infectious clones of PgCoV GD/2019, RsSHC014, and WIV-1 expressing nanoluciferase, were derived and isolated as working stocks as previously described60,61,62.
Toxicity of VeroE6 cells with SARS-CoV-2 mNeon Green virus as measured by an MTS reduction assay 65
Cytotoxicity was evaluated on day 5 in treated but uninfected cells using an MTS (3-(4,5-dimethylthiazol-2-yl)-5-(3-carboxymethoxyphenyl)-2-(4-sulfophenyl)-2H-tetrazolium, inner salt) reduction assay65.
The toxicity was determined by exposing non-contaminated inserts to the same amount of JNJ-9676 as for treatment with antivirals, which is representative of the cell layers integrity or health. Brefeldin was used as a toxicity control.
The day before the infection, Vero E6 cells wereseeded in well plates. Cells were infected with an MOI of 1 TCID50 per cell (SARS-CoV-2 GHB) and compounds were added 0, 3, 5 and 7 h after infection. After 10 h after the attack, the supernatant was removed and cells either lysed or collected for the purpose of quantification of vRNA levels. For the time-of-drug-addition assay with reporter cells and reporter virus, VeroE6–mCherry cells were seeded in 96-well plates the day before infection. Cells were infected with SARS-CoV-2–mNeonGreen virus (at a final MOI of 0.1 TCID50 per cell) and compounds were added −0.5, 0, 2, 4, 6 and 8 h after infection. The percentage inhibition relative to the control was calculated after the number of infections is calculated, after cells were imaged with high-content scanning.
FabB sequence cloned into pcDNA 3.4 vector with an addition of C-terminal gLUC signal sequence in a HisTrap excel column
The sequence encoding the heavy chain of FabB2 was modified to contain a truncated C terminus to block Fab dimer formation (-CKPCICTVPEVSS) and cloned into the pcDNA3.4 vector with an added C-terminal 6×His-tag containing a linker (GS-GS-HHHHHH). The sequence encoding the light chain of FabB2 was cloned into a pcDNA3.4 vector with an added N-terminal gLUC signal sequence (MGVKVLFALICIAVAEA).
Conditioned medium was loaded onto a 10 ml HisTrap excel column (Cytvia) at a flow rate of 8 ml min−1. The column was washed with 6 CV of wash buffer (20 mM sodium phosphate pH 6.5, 150 mM NaCl, 20 mM imidazole) and eluted with over 5 CV using a 39.2–500 mM imidazole gradient prepared in buffer (20 mM sodium phosphate pH 6.5, 150 mM NaCl, 500 mM imidazole). The peak fractions of FabB were separated from the rest by using a buffer comprised of 20 mM of sodiumphosphate and 150 mM of oxygen. Is it NaCl?
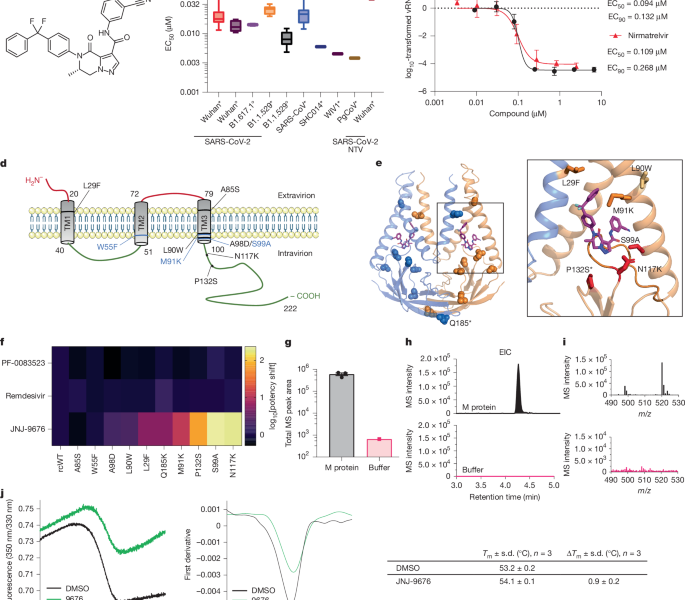
Experiments were performed in 10 l. A Prometheus NT.Plex instrument (NanoTemper Technologies) was used to measure the melting temperatures. The samples were prepared in a 384-well plate with 0.5 mg ml−1 purified recombinant SARS-CoV-2 M and 100 µM of JNJ-9676 in 20 mM HEPES pH 7.5, 150 mM 0.05% GD (w/v), 0.05% PSO, 0.0001% CHS, and 1% DMSO. The samples loaded into standard grade glass were measured under a temperature range of 25–95 C and with a temperature difference of 1 C min1 to record the intrinsic protein fluorescence. The data was analysed using the PR. ThermControl v.2.1.6
The sample types included in the offline ASMS experiment were compound QC, M protein and no-protein control.
For the preparation of SEC filter plates for offline ASMS, 130 µl of pre swollen Bio-Gel P10 resin slurry was added to each well of a low-protein-binding Millipore HTS 384 HV filter plate (hereafter, size-exclusion plate) with a 0.45 µm Durapore (PVDF) membrane (MZHCN0W10). The flowthrough was discarded when the plate was placed into a 4 C refrigerated Centrifuge at 1,000g. Each cartridge was then washed a total of four times using 50 µl buffer containing 20 mM HEPES, pH 7.5, 150 mM NaCl, 0.001% LMNG, 0.0001% CHS, 0.00033% GDN and 2% DMSO, whereby the flowthrough from each wash was discarded after centrifugation at 1,000g for 2 min. A portion of the 5 mM compound was transferred from the source plate to the four wells of the V- bottom plate with the help of an acoustic liquid handler. A sample of the stock solution was taken out of ice and then put into a buffer to work at a concentration of 5% and 2%. 20 l of the resulting work was placed into three wells containing compound that yielded a final concentration of 5 M. To control for compound breakthrough of the SEC resin, either in-solution or through micelle partitioning, a separate working stock was prepared without protein and dispensed as a 20 µl aliquot into the remaining compound well. The plate was centrifuged at 1,000g for 1 min at room temperature and incubated at 25 °C for 30 min.
All of the samples were transferred to the size-exclusion plate, which was quickly centrifuged at 1,000g for 2 min at 4 °C to minimize compound breakthrough. The resulting flowthrough was diluted with 15 µl MS-grade water (Honeywell) to reduce the detergent concentration and centrifuged further at 2,000g for 5 min at room temperature to collect any insoluble precipitate.
The compound QC sample was prepared separately without additional handling, whereby a 5 nl aliquot of 5 mM compound in DMSO was transferred from the source plate into a 384-wellplate and combined with 25 µl of 49% acetonitrile, 2% DMSO solution.
We incubated 5 µM M protein for 30 min at 25 °C in buffer only (20 mM HEPES, pH 7.5, 150 mM In buffer with.94, or with 2% DMSO, or in the final concentration. The compound was removed from the bound compound by a method called Spin Desalting. Experiments were done in triplicate. A time-of-flight for liquid chromatography with tandem mass spectrometry was used to do the mass-spectrometry tests. For data analysis, the Agilent Mass Hunter Qualitive Analysis software (target screening workflow) and the Find by Formula method for compound identification by mass/isotope pattern matching was used. A mass error tolerance window of 10 parts per million was used to extract the peak area of the EIC.
Themasses were separated and merged using a mass error tolerance window of 3 ppm during the data processing.
Extraction of 3 l of recombinant M protein in Cryo-EM using the PELCO easiGlow Discharge Cleaning System
The PELCO easiGlow Discharge Cleaning System was used to illuminate the mesh grids. A total of 3 l recombinant M protein sample, prepared as described above, was applied to the grids using the following settings: Blotter time 4S, blot force 0 Liquid ethane was cooled by liquid nitrogen. Cryo-EM data collection was automated on the 200 kV Thermo Scientific Glacios microscope controlled by EPU software. Micrographs were taken at ×105,000 magnification using a Facon4 detector (Gatan) in counting mode. Each exposure took 40 frames with a total dose of 40 e 2. The calibrated physical pixel size for all digital micrographs was 0.910 Å. All details corresponding to individual datasets are summarized in Extended Data Table 6.
The Fab–E and Fab–B complexes had patch motion correction performed using an output F-crop factor of 0.5. Micrographs with a CTF estimated resolution of worse than 10 Å were discarded, leaving 5,058 and 5,036 images for further processing, respectively. The blob picker tool was then used to select 4,327,548 and 4,497,785 particles, respectively, which were then extracted in an 80-pixel box (Fourier binned 4.5 × 4.5). For the Fab–E complex, two rounds of 2D classification were done, resulting in 270,970 particles being selected for further processing. Ab initio reconstruction created one reconstruction of the Fab–E complex. This class had their particles re-analyzed and put into a box. After the particles were Fourier binned, they were reconstructed with a global resolution of 3.3. Ab initio reconstruction generated one well-defined reconstruction of the Fab–B complex. The reconstruction of the Fab–B complex from the initial ab initio job as a reference volume was used to identify all Fab–B complex particles. This was followed by two final rounds of ab initio to further isolate the best-quality particles for final reconstruction. The remaining 73,185 particles were then re-extracted in a 360-pixel box. During extraction, particles were Fourier binned by a non-integer value, resulting in a final pixel size of 0.836 Å. Subsequently, non-uniform refinement was done on the extracted particles with C2 symmetry imposed60, yielding a reconstruction with a global resolution of 3.3 Å. Reference-based motion correction was successfully run on 72,998 of the re-extracted particles. These particles were then subjected to a final non-uniform refinement, with C2 symmetry imposed60, yielding a final reconstruction with a global resolution of 3.2 Å. All resolution estimates were calculated using a gold standard fifidel shell correlation criterion, and 3D-FSC plots were created using cryoSPARC61 Globally refined maps were manually adjusted by local resolution.
The gold standard was used to estimate resolutions by applying a soft mask around the complex density. The criterion is 0.143. The density maps were made sharper using different negative temperature factors along with the half maps and used for model building. ResMap was used to determine local resolution. There are statistics for the cryo-EM data processing in the extended data fig. 6a–f
The initial model for atomic model building of the EM map was created using a human SARS- CoV-2 Mprotein dimer in a complex with FabB. For the M–FabB complex model building, the M protein was manually built using COOT68. The FabB was fitted into the map using a program called Chimera and refined manually by COOT, then real-space refine in Phenix69. In the table, there are structural refinements statistics in the form of an extended data table. 6g. Structure representations were generated using Pymol (v.2.0)70 and Chimera71.
Statistical analyses for the blind diagnosis of lung damage in the presence of haematoxylin and eosin staining
For histological examination, the fixed lung tissue sections (5 μm) were analysed after staining with haematoxylin and eosin and scored blindly for lung damage by an expert pathologist. The scored parameters, (cumulative score, 1 to 3), were as follows: congestion, intra-alveolar haemorrhagic, apoptotic bodies in the bronchus wall, necrotizing bronchiolitis, perivascular oedema, bronchopneumonia, perivascular inflammation, peribronchial inflammation and vasculitis.
All statistical analyses were performed in GraphPad Prism v.9.5.0 and validated using R (v.3.6.1). The lung viral-load data was applied to a log10 transformation. The mean differences between the treatment groups and the vehicle group were estimated using the one-way analysis of variance with Šídák’s multiplicity correction to account for multiple testing.
In the case of lung histopathology normality could not be assumed, the nonparametric Kruskal–Wallis test was applied. The following tests were applied to account for multiple testing: the Benjamini–Hochberg multiplicity correction and the post hoc Dunn’s test. The significance level was used.
The graphs were prepared with GraphPad Prism. A number of figures and schemes were created using various methods.
All statistical comparisons were done in GraphPad Prism and the tests used are in the figure legends. Three independent preparations procured the 2D ems for the purpose of quantitating the DMVs. Tomography was acquired on a selection of technical duplicates of the samples previously characterized in 2D, with the exception of the HPF samples that were prepared in duplicates in one preparation.
First-principles determination of the stability of (nsp_1+ns_2) by using a robotized Biomek I5 automate
The stability of the compound was determined by using the mouse and hamster microsomal fractions, as well as by using the human microsomal fractions. cubations were done at 37 C for 120 min At various time points (5, 15, 30, 60 and 120 min), 25 μl of the reaction mixture was sampled and quenched in 300 μl of acetonitrile containing internal standard. The suspension was whirled, and the supernatant had to be suckn with water. The resulting solution was analysed by liquid chromatography with tandem mass spectrometry to determine the half-life of the compound.
The IC50 was determined using this equation: percentage of active enzyme = 100/(1 + I2/IC50), where I is the concentration of inhibitor and 100% of activity is the fluorescence intensity without the inhibitor. Curve fitting using the software was used to determine the IC50. For each measurement, results were obtained in triplicate.
Reaction assays were stopped by adding 20 µl EDTA (100 mM). Positive and negative controls consisted of a reaction mix with 5% DMSO (final concentration) or EDTA (100 mM) instead of compounds, respectively. The mix was transferred to the plate using the Biomek I5 automate. PicoGreen fluorescent reagent was diluted to 1/800 in TE buffer, according to the manufacturer’s instructions, and 60 μl of reagent was distributed into each well of the Greiner plate. After 5 min at the dark the plate was taken out and the signal was read with a Tecan Safire2 and/or a ClarioStar.
Reactions were performed in a volume of 40 l. All experiments were robotized by using a BioMek I5 automate (Beckman). Then, 2 µl of each diluted compound in 100% DMSO was added in wells to the chosen concentration (5% DMSO final concentration). The active complex was pre-formable by distributing the (nsp8L7 + nsp8) mix to wells after an 8-min incubation at room temperature. Nsp12 was added to wells and put in the bin for 8 minutes. Reactions were started by adding the UTP + poly(A) template mix and were incubated at 30 °C for 20 min, using 350 nM of poly(A) template and 750 µM of UTP final concentration.
The compound concentrations leading to 50% inhibition was found in the IC50 buffer which contained seven increasing concentrations of compound. There are 450 nM nsp8 and 450 nM nsp8L7 in the complex.
Black 384-well HiBase non-binding plates were used for activity and inhibition. The concentrations of the inhibitor were increased while they were being housed in the HEPES buffer with a fluorescent synthetic peptide (Dabcyl- FTLKGGAPTK- Edans, Genscript). EDTA, 4 mM DTT and 10% glycerol. The final concentration of DMSO was adjusted to 0.5%. The Edans/Dabcyl fluorophore–quencher pair is separated by the degradation of the fluorogenic peptide. The time courses of the reaction were followed for 40 minutes with the monitoring of the increase in the fluorescence emission using a Tecan Safire2 fluorimeter. The calculation of the slope of the linear part of the reaction curve was used to estimate enzymatic activities.
A fluorescent substrate comprising the cleavage site of SARS-CoV-2 Mpro (Dabcyl-KTSAVLQ↓SGFRKM-E(Edans)-NH2) and buffer composed of 20 mM HEPES, 120 mM NaCl, 0.4 mM The inhibition assays were done with edTA, 4 mM DTT, 20% glycerol, pH 7.0. The Edans generated as a result of Mpro’s cleavage in the FRET-based test were seen at an emission wavelength of 450 to 410 nanometers with a tecan Spark multimode microplate. The compound was mixed with 100% DMSO to make a solution. The IC50 of CIM-834 was determined after incubation of 0.5 µM of SARS-CoV-2 Mpro and CIM-834 at various concentrations from 0 to 500 µM in reaction buffer at 37 °C for 10 min. Each well had a final FRET concentration of 50 M added to it at a final volume of 100 l to begin the reaction. The IC50 value was calculated with the help of the GraphPad Prism 9.2.0 software. The data is presented as mean s.d. and the activity was measured in triplicates. Positive control tests against Mpro were also performed.
The coding sequences for SARS-CoV-2 Wuhan-Hu-1 (GenBank: NC_045512.2) were used for recombinant protein expression. Nsp3 (PLpro domain), nsp15 (Mpro domain), nsp14 (N7-MTase), nsp10 and nsp16 (2′O-MTase) were cloned in fusion with an N-terminus hexa-histidine tag, as previously described75. The proteins were conjugated using the IMAC bead. In brief, after cell sonication in a buffer. Tris is pH 6.8. The imidazole, 10 mM, 5mM and 1 mM B ME were supplemented with 0.25 grams of lysozyme. The MTases were subsequently purified by size-exclusion chromatography (GE Superdex S200) in a final buffer of 50 mM The tris has a pH of 6.8. 5 mM BME and NaCl are used. The segregation was performed using Viva spin 20 Centrifugal Concentrates with a 10 kDa MWCO dialysing against the elution buffer and stored in a buffer containing 50% glycerol at 20 C. The replication/transcription complex endowed with RdRp activity was purified and assembled, according to ref. Variations described in the ref. There is no relation to 77.
The Huh-7 cells were placed on the covers in a ratio of 8 to 104 per well. The next day, 1 µM CIM-834 or DMSO was added to the medium and cells were transfected with a total of 250 ng plasmid encoding for V5-tagged WT-M using the TransIT-LT1 transfection reagent (Mirus Bio). Then, 16 h after transfection, cells were fixed with 4% paraformaldehyde in PBS for 20 min at room temperature, followed by permeabilization with 0.1% Triton-X100 in PBS for 3 min at room temperature. The V5-tagged M genes were visualized with anti-V5 monoclonal antibody in 10% normal horse serum after a blocking step of 15 min at room temperature. The trans-Golgi network was visualized using polyclonal sheep anti-human TGN46 antibodies (AHP500, BioRad,1:500), followed by incubation with Cy3-conjugated donkey anti-sheep IgG antibodies (Jackson ImmunoResearch, 713-165-147, 1:500). Nuclei were visualized using 1 µg ml−1 of 4′,6-diamidino-2-phenylindole (DAPI), and coverslips were mounted in Mowiol mounting medium. The pictures were taken with an LSM 880 confocal laser scanning microscope. The extent of colocalization between M and TGN46 was measured using the JACoP plug-in of ImageJ. 25 cells were analysed for both treatment and treatment with no changes.
LigPlot 71 and UC Davis ChimeraX72 were used to calculate the Interactions between M and CIM- 834. The UCSF Chimera MatchMaker tool was used to obtain root mean square deviation values using default settings. Figures were generated using UCSF ChimeraX72, and structural-biology applications used in this project were compiled and configured by SBGrid73.
The M proteins was combined with the other substances for the Fab–E and Fab–B complexes. All components were diluted in a buffer solution comprising 20 mM HEPES-NaOH at pH 7.7, 150 mM NaCl, 0.0025% LMNG and 0.00025% CHS. Samples were mixed and incubated for 15 min on ice before vitrification. The sample was pipetted onto glow-discharged R1.2/1.3 200 mesh holey copper carbon grids and plunge-frozen in liquid ethane using a Vitrobot mark IV. Both datasets were collected at the Netherlands Center for Electron Nanoscopy. Grids were loaded into a Titan Krios electron microscope (Thermo Fisher Scientific) operating at 300 kV, equipped with a K3 direct electron detector and Bioquantum energy filter (Gatan). The slit width of the energy filter was set to 20 eV. Imaging was done at a nominal magnification of ×81,000 and ×105,000 for Fab–E and Fab–B, respectively, in super-resolution mode using EPU software (Thermo Fisher Scientific). A total of 5,058 and 5,037 movies were recorded for the Fab–E and Fab–B complexes, respectively. Data acquisition parameters are summarized in a table.
The semithin sections of 200 or 300 nm were examined using a Gatan One View camera and the screen was done using a Tecnai F30 microscope. Target positions were manually selected and acquired at ×15,500 magnification (−60° to +60° per axis; increment, 1°) by single-axis tomography (0.78 nm per pixel). The tilt series was reconstructed using information from IMOD 56. The method of segmenting tomograms was done manually with the help of the brush segment tool in Amira-Avizo software.
Cells were exported from BSL3 in 6% of PFA, similar to the samples on the cover of a book. The samples were then immersed in 100 mM. PHEM with 15% BSA as a cryo-protectant and high-pressure frozen using a BalTec HPM-010 with carriers forming a 40 µm-deep cavity (3-mm aluminium carriers, type B 0/0.3 mm and type 748 0.04/0.020 mm, Engineering Office M. Wohlwend). High-pressure frozen samples were then subjected to freeze substitution in a Leica AFS II using cryo-tubes with screw caps and rubber sealing rings, containing 1 ml of fixative cocktail composed of 0.2% OsO4, 1% uranyl acetate and 5% water in acetone. The AFS chamber temperature was increased over the course of 24 h as follows: 1 h at −90 °C; 8 h at −90 °C to −80 °C; 8 h at −80 °C to −50 °C; 2 h at −50 °C to −20 °C; 2 h at −20 °C to 0 °C. Samples were then rinsed for 5 min with dry acetone on ice and further processed using a microwave, rinsed twice with ethanol for 40 s at 250 mW and infiltrated with increasing Epon 812 concentrations in ethanol (10%, 30%, 50%, 70%, 90% and 2 × 100% for 3 min each in a BioWave vacuum cycling system). sapphires were transferred to plastic moulds and then put into 72 h of brine at 60 C. Ultrathin and semithin sections of 70 nm or 300 nm, respectively, were generated for both chemically fixed and high-pressure frozen samples using a UC7 Leica ultramicrotome and a 30° diamond knife (Diatome) and collected on Pioloform-coated slot grids. For 5 min grids were post stained with 3% uranyl Acyl in 70% Methanol and 2% lead citrate. The Serial-EM Navigator, along with a procedure adapted from ref., are needed to locate the cells. 55 were used to map the central section of a ribbon of 5 using a camera. Cells displaying a DMV cluster were identified and stored in the map, and navigator maps and grids were then transferred to a JEOL 2100+ equipped with a Matataki sCMOS camera to acquire montages, covering the whole perinuclear region of the selected cells at a magnification of ×6,000 or ×15,500.
Source: A coronavirus assembly inhibitor that targets the viral membrane protein
Cell growth studies in Dulbecco modified Eagle medium supplemented with 5% v/v heat-inactivated serum and 100 g ml1 geneticin
An ethics committee at the KU Leuven approved animal housing conditions and experimental procedures.
GS-454 was obtained from MedChem Express. Hydroxychloroquine was purchased from Cell Signaling Technology (85523S). Nirmatrelvir (PF-07321332) was from Wuxi.
VeroE6–GFP cells (African monkey kidney cell line expressing green fluorescent protein; provided by M. van Loock, Janssen Pharmaceutica40) were maintained in Dulbecco’s modified Eagle medium (DMEM) supplemented with 10% v/v heat-inactivated fetal bovine serum (FBS) + 0.5 mg ml−1 geneticin. VeroE6–mCherry cells (generated as described in ref. 41) were maintained in DMEM, supplemented with 10% (v/v) heat-inactivated FBS and 10 μg ml−1 blasticidin. The A549ACE2+TMPRSS2 cells (a human lung carcinoma cell line overexpressing human ACE2 and human TMPRSS2 receptors), used for antiviral studies, were from InvivoGen (a549d-cov2r, A549-Dual hACE2-TMPRSS2 cells) and were cultured in DMEM supplemented with 10% v/v heat-inactivated FBS, 300 μg ml−1 hygromycin, 0.5 μg ml−1 puromycin and 10 μg ml−1 blasticidin. The cells were made using lentiviral transduction with pWPI vectors and 500 g geneticin. These cells were cultivated in DMEM supplemented with 10% (v/v) FBS, 100 U ml−1 penicillin, 10 µg ml−1 streptomycin and 1% non-essential amino acids. The cell growth medium containing 2% was used instead of 10%, for the assays using VeroE6– GFP, VeroE6–mCherry and A 54ACE2+ tmss2 with virus replication. The cell cultures were done at 37 C and 5% CO2. BHK-21 cells (Baby hamster kidney cell line obtained from ATCC, CCL10) were maintained in Glasgow MEM (Invitrogen) supplemented with 5% v/v FBS, 10% tryptose phosphate broth, 100 U ml−1 penicillin, 100 µg ml−1 streptomycin and 10 mM HEPES, pH 7.4. Cells were kept in Eagle’s minimal essential medium for transfection experiments. Huh7 cells were cultured in DMEM supplemented with 10% FBS and 1 mM Glutamax.
Nirmatrelvir (from Excenen, batch EXA5024) was formulated as a 100 mg ml−1 and 33.3 mg ml−1 stock (for 300 mg per kg and 100 mg per kg dosing, respectively) in a vehicle containing 43% absolute ethanol and 27% propylene glycol (Sigma) in sterile distilled water. CIM-834 was formulated as 20 mg ml−1 in 14% propylene glycol (Sigma), 1% Tween 80 (Sigma), 85% pH 5 citrate buffer. To evaluate efficacy, male SCID mice were treated with either the vehicle or oral gavage. For virus infection, animals were anesthetized with isoflurane and inoculated intranasally with 40 µl containing 105 TCID50 On the first day, the variant of the name was called SARS-coV-2. Animals were diagnosed with an infectious disease on the first day of the therapy and were given a treatment consisting of 100MG per tHe twice a day for up to 48 hours. Mice were housed in individually ventilated cages with three mice per cage and monitored daily for weight changes and any clinical signs. Animals were euthanized by injection of 100 l Dolethal (200 l sodium pento barbital, Vtoquinol SA) and lungs were collected after 3 days after infections. End-point virus titration was used to calculate infectious viral lung loads. To prevent carry-over of the compound during determination of infectious virus titres, the cells were washed and given fresh medium, immediately after incubation for 2 h with lung homogenates. TCID50 read-out took place three days after the cells were initially incubated at 37 C.
All plasmids were validated by Sanger sequencing (Macrogen). The method for preparation of viral DNA in a lab was previously described51, but not for the use of an ECM 830 Square Wave electroporation system, a 3s interval, BTX. The electroporated cells were added to A549ACE2+TMPRSS2 cells (InvivoGen) in medium containing 10% FCS. After 6h at 37C, the medium was replaced by the smallest type of animal in nature. Four days later, the virus stocks were collected, passaged once on A549ACE2+TMPRSS2 (InvivoGen) and subjected to whole-genome sequencing (Oxford Nanopore Technologies, by B. Vanmechelen, Rega Institute) to verify the desired sequence.
For this, cell lysates were put into VeroE6 monolayers in 12well plates and then put in a 37C petri dish for 1 h. Subsequently, the inoculum mixture was replaced with 0.8% (w/v) methylcellulose in DMEM supplemented with 2% FBS. After three days of incubation at 37 °C, the overlays were removed, the cells were fixed with 3.7% PFA and stained with 0.5% crystal violet, and plaques were counted visually.